Software Thread View
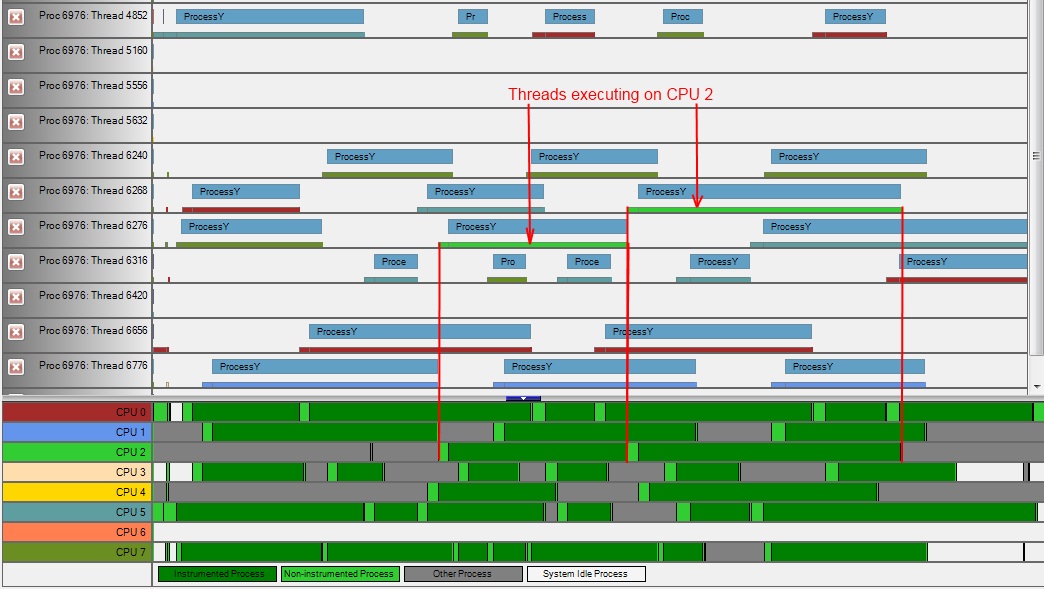
The Software Thread View displays each task as a colored rectangle, where the width of the rectangle corresponds to the length of the task, and the vertical position corresponds to the nesting depth of the task. It also displays each event as a colored caret along the top edge of the track.
You can disable undesirable task tracks if you want. Disabled tracks are excluded from the selection.
On files containing hardware context data, the colors on the bottom of software tracks indicate when a thread is actually running (vs. swapped out) and provide a visual way to see which CPU core the software thread is running on at any given time. See the picture below.

See Also
Disabling Undesirable Task Tracks
About the Task Timeline